


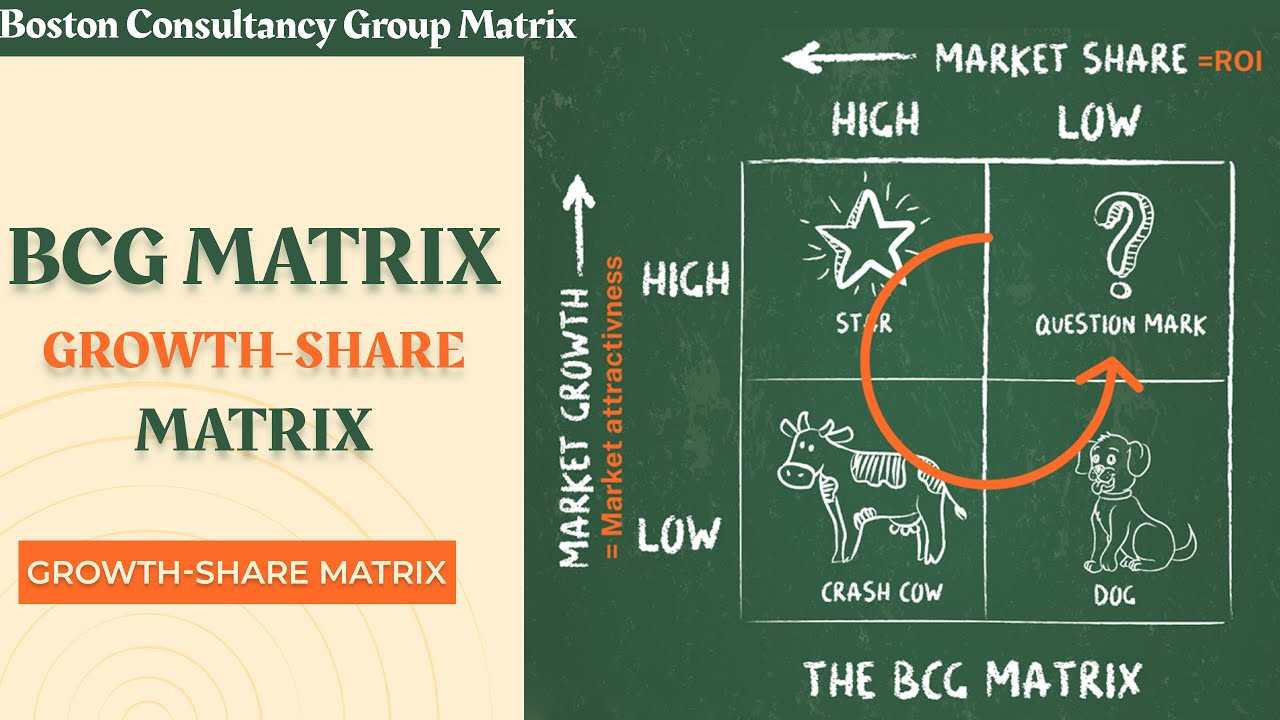
The BCG Matrix is a strategic planning framework that classifies a company’s products or business units into four categories based on two factors: relative market share and market growth rate.
Developed by Bruce Henderson at the Boston Consulting Group in 1970, the BCG Matrix — also called the Growth-Share Matrix — gives business owners and marketers a clear visual tool for deciding where to invest, what to grow, and what to cut from their product portfolio.
This article covers what the four BCG Matrix quadrants mean, how to read the matrix, a real-world small business example, its limitations, and how it compares to the GE-McKinsey Matrix.
Key Takeaways
- The BCG Matrix was created by Bruce Henderson of the Boston Consulting Group in 1970 to help companies manage diversified product portfolios.
- The matrix plots products on a 2×2 grid using two axes: relative market share (horizontal) and market growth rate (vertical).
- The four quadrants are Stars, Cash Cows, Question Marks (also called Problem Children), and Dogs — each with a different investment strategy.
- Cash Cows are the financial engine of a healthy portfolio: they generate surplus cash that funds investment in Stars and selected Question Marks.
- The BCG Matrix is a starting-point tool, not a final decision. It works best alongside tools like SWOT Analysis and Porter’s Five Forces for a complete strategic picture.
What Are the Four Quadrants of the BCG Matrix?
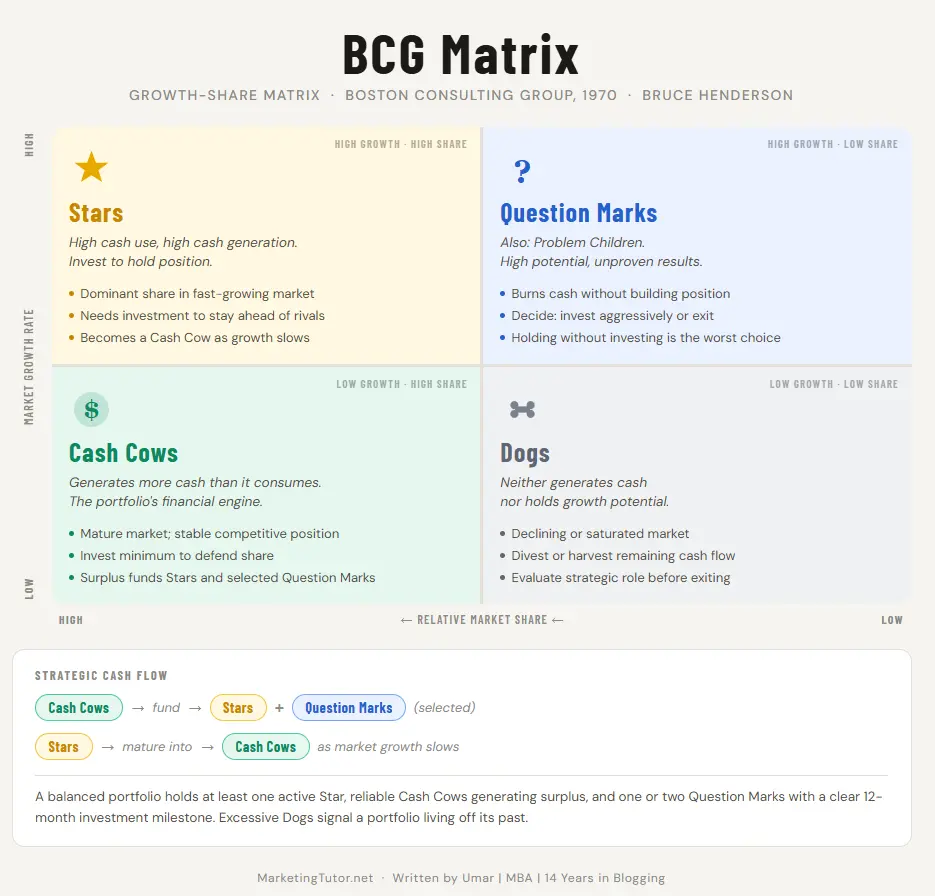
The matrix divides products or Strategic Business Units (SBUs) into four categories. Position on the grid determines the recommended investment strategy.
Stars: What Are They and How Do You Manage Them?
Stars are products with high market share in a fast-growing market. They are your current strongest performers.
Stars require continued investment to maintain their position as the overall market expands. The fast growth means competitors are also investing aggressively, so you need to keep spending to hold share. Over time, when market growth slows and your share stays high, Stars mature into Cash Cows.
Example: Apple’s iPhone during its first four years (2007–2011) was a Star — rapidly growing smartphone market, dominant share, but requiring enormous R&D and marketing investment to stay ahead.
Cash Cows: What Role Do They Play in the Portfolio?
Cash Cows have high market share in a slow-growing or mature market. They generate more cash than they consume.
Because the market is not growing fast, competitors aren’t aggressively entering. Your position is stable. The standard BCG strategy here: invest the minimum needed to defend market share, extract the surplus cash, and redirect it toward Stars and promising Question Marks.
Example: Microsoft Office held Cash Cow status for over a decade — dominant share in a mature productivity software market, generating billions in annual cash flow that funded Microsoft’s expansion into cloud computing.
Question Marks: Should You Invest or Walk Away?
Question Marks — also called Problem Children — have low market share in a fast-growing market. High potential, unproven results.
This is the quadrant that demands the hardest strategic decision. You have three options: invest heavily to gain share and push the product toward Star status; divest and redeploy cash elsewhere; or do nothing, which is the worst outcome — the product consumes cash without building position.
The Harvard Business Review notes that most Question Marks never become Stars. Selective investment in the Question Marks with the clearest path to differentiation is the right approach.
Dogs: When Should You Keep Them?
Dogs have low market share in a slow-growing or declining market. They neither generate meaningful cash nor hold strong growth potential.
The original BCG recommendation was to divest Dogs. In practice, it isn’t always that simple. Some Dogs anchor a product line, serve a specific customer segment, or share infrastructure with a profitable product. Evaluate each Dog individually before acting. For most small businesses, a Dog product consuming significant time and resources without generating proportional revenue is a clear candidate for phase-out.
How Do You Read the BCG Matrix?
The horizontal axis represents relative market share — your share compared to your largest single competitor. A score above 1.0 means you lead the market. If you hold 30% share and your biggest competitor holds 15%, your relative market share is 2.0.
The vertical axis represents market growth rate. A common threshold is 10% annual growth — above that is “high growth,” below is “low growth.” The exact cutoff depends on your industry; you set the threshold based on what’s normal in your market.
The dividing line between quadrants is not fixed. Companies define their own thresholds. This is a feature, not a flaw — it keeps the tool relevant across different industries and market conditions.
What Is the BCG Matrix Used For?
Companies apply the BCG Matrix to three types of strategic decisions.
Resource allocation. Which products get budget and which don’t. The matrix creates a shared visual language for those conversations — much easier than debating abstract numbers in a spreadsheet.
Portfolio balance. A healthy portfolio has active Stars, reliable Cash Cows, and a few carefully managed Question Marks. A company with only Cash Cows is living off past success with no pipeline for future growth. A company with only Stars and Question Marks is burning cash without a funding mechanism.
Divestiture decisions. When a product is performing poorly, emotions and legacy often keep it on life support. The BCG Matrix gives leadership a framework for discontinuing products based on strategic logic, not just sentiment.
BCG Matrix Example — Small US Marketing Agency
A small marketing agency in Chicago offers four services. Here’s how they map onto the BCG Matrix:
| Service | Market Growth | Relative Market Share | Quadrant | Strategy |
|---|---|---|---|---|
| Local SEO consulting | High (12% annual) | High (leads local competitors) | Star | Invest to hold and grow |
| Print brochure design | Low (2% annual) | High (established local reputation) | Cash Cow | Maintain; harvest surplus |
| Social media management | High (18% annual) | Low (recently launched) | Question Mark | Selective investment; decide within 12 months |
| Yellow Pages advertising | Declining (-8% annual) | Low (minimal demand) | Dog | Phase out; stop active selling |
The strategic read: use Cash Cow revenue (print design) to invest in the Question Mark (social media). Set a 12-month performance target for social media. If it’s not gaining share, exit the service and redeploy resources to Local SEO,
BCG Matrix vs. GE-McKinsey Matrix: What’s the Difference?
| Feature | BCG Matrix | GE-McKinsey Matrix |
|---|---|---|
| Creator | Bruce Henderson, BCG (1970) | McKinsey & Company + GE (1970s) |
| Grid size | 2×2 (4 quadrants) | 3×3 (9 cells) |
| Axes | Market growth rate + Relative market share | Industry attractiveness + Business unit strength |
| Complexity | Simple, fast to apply | More nuanced, requires more data |
| Best for | Initial portfolio screening | Detailed enterprise-level planning |
| Key limitation | Ignores competitive intensity within markets | Scoring criteria are subjective |
| US adoption | Standard MBA curriculum tool | Preferred by large enterprise strategy teams |
Both frameworks serve portfolio planning. For small and mid-size US businesses, the BCG Matrix is faster to apply and easier to communicate to a team. The GE-McKinsey Matrix is worth using when the BCG analysis raises more questions than it answers.
What Are the Main Limitations of the BCG Matrix?
Does the BCG Matrix Oversimplify Business Strategy?
Yes, and knowing where it falls short makes you a better user of it.
It treats market share as a proxy for profitability. High share does not guarantee strong margins in every industry. In fragmented markets or commodity categories, a niche player with lower share can outperform the market leader on profit per unit.
It ignores competitive dynamics inside each quadrant. Two Stars can face completely different competitive pressures. The matrix treats them identically. For a deeper competitive read, a Porter’s Five Forces analysis applied to each unit reveals what the matrix hides.
It assumes business units are independent. Products often share supply chains, brand equity, customer relationships, and manufacturing capacity. Divesting a Dog can damage a Cash Cow that shares infrastructure with it.
Market growth rate is a single blunt number. A “market” often contains segments growing at very different rates. Two products in the same stated market can be in completely different growth environments.
Use the BCG Matrix as a starting-point visual, then apply richer tools before making final decisions.
Bottom Line
After 14 years of working with businesses on marketing and growth strategy, I’ve seen two failure modes with the BCG Matrix. The first is treating it as a final verdict — cutting Dogs and doubling Stars based purely on the grid without looking at the competitive and operational context. The second is dismissing it as too simplistic and never doing the portfolio snapshot at all.
The BCG Matrix is best used as a conversation starter for your leadership team. Run it in 30 minutes. Get everyone looking at the same visual. Then go deeper with your actual market data. The discipline of categorising your products forces strategic clarity that most small businesses never get, and that clarity alone is worth the exercise
Frequently Asked Questions
BCG stands for Boston Consulting Group, the US management consultancy that created the Growth-Share Matrix in 1970. Bruce Henderson, BCG’s founder, developed the framework to help large corporations decide how to allocate investment across multiple product lines and business units. It is now a standard component of MBA strategy programs worldwide.
The four quadrants are Stars (high market share, high growth rate), Cash Cows (high market share, low growth rate), Question Marks or Problem Children (low market share, high growth rate), and Dogs (low market share, low growth rate). Each quadrant carries a different recommended investment and management strategy based on the product’s position.
Stars and Cash Cows both have high relative market share. The difference is the market growth rate. Stars operate in fast-growing markets and still require significant investment to maintain their position. Cash Cows operate in slow-growing or mature markets, generate more cash than they consume, and fund investment in Stars and Question Marks. Stars often become Cash Cows as their market matures and growth slows.
Relative market share is your product’s market share divided by the market share of your largest single competitor. For example, if your product holds 30% of the market and your largest competitor holds 15%, your relative market share is 2.0. A score above 1.0 means you lead your market. A score below 1.0 means a competitor holds more share than you do.
The BCG Matrix applies to either level. Large corporations use it to evaluate Strategic Business Units (SBUs) within a conglomerate portfolio — each SBU treated as a single entity. Small businesses use it to evaluate individual product lines or service offerings. The framework works at whichever level you make your investment and divestiture decisions.
The original BCG recommendation is to divest Dog products or harvest them — extract remaining cash flow and stop further investment. In practice, this isn’t always the right move. Some Dog products serve strategic roles: completing a product line, retaining a key customer, or sharing infrastructure with a profitable product. Evaluate each Dog case by case. If a Dog consumes significant resources without a clear strategic justification, phasing it out is usually the right call.
The BCG Matrix evaluates your existing portfolio — where current products sit on market share and growth dimensions. The Ansoff Matrix focuses on future growth strategy — which direction to grow through market penetration, market development, product development, or diversification. The two tools are complementary: use the BCG Matrix to assess what you have, and the Ansoff Matrix to plan where you want to go next.

